8.36 contour 
This module draws contour lines.
To construct contours corresponding to the values in a real array c
for a function f on box(a,b), use the routine
guide[][] contour(real f(real, real), pair a, pair b,
                  real[] c, int nx=ngraph, int ny=nx,
                  interpolate join=operator --, int subsample=1);
The integers nx and ny define the resolution.
The default resolution, ngraph x ngraph (here ngraph
defaults to 100) can be increased for greater accuracy.
The default interpolation operator is operator -- (linear). Spline
interpolation (operator ..) may produce smoother
contours but it can also lead to overshooting.
The subsample parameter indicates the number of interior points
that should be used to sample contours within each 1 x 1 box;
the default value of 1 is usually sufficient.
To construct contours for an array of data values on a uniform
two-dimensional lattice on box(a,b), use
guide[][] contour(real[][] f, pair a, pair b, real[] c,
                  interpolate join=operator --, int subsample=1);
To construct contours for an array of data values on a nonoverlapping
regular mesh specified by the two-dimensional array z,
guide[][] contour(pair[][] z, real[][] f, real[] c,
                  interpolate join=operator --, int subsample=1);
To construct contours for an array of values f specified at
irregularly positioned points z, use the routine
guide[][] contour(pair[] z, real[] f, real[] c, interpolate join=operator --);
The contours themselves can be drawn with one of the routines
void draw(picture pic=currentpicture, Label[] L=new Label[],
          guide[][] g, pen p=currentpen);

void draw(picture pic=currentpicture, Label[] L=new Label[],
          guide[][] g, pen[] p);
The following simple example draws the contour at value 1
for the function z=x^2+y^2, which is a unit circle:
import contour;
size(75);

real f(real a, real b) {return a^2+b^2;}
draw(contour(f,(-1,-1),(1,1),new real[] {1}));

The next example draws and labels multiple contours for the function
z=x^2-y^2 with the resolution 100 x 100, using a dashed
pen for negative contours and a solid pen for positive (and zero) contours:
import contour;

size(200);

real f(real x, real y) {return x^2-y^2;}
int n=10;
real[] c=new real[n];
for(int i=0; i < n; ++i) c[i]=(i-n/2)/n;

pen[] p=sequence(new pen(int i) {
    return (c[i] >= 0 ? solid : dashed)+fontsize(6pt);
  },c.length);

Label[] Labels=sequence(new Label(int i) {
    return Label(c[i] != 0 ? (string) c[i] : "",Relative(unitrand()),(0,0),
                 UnFill(1bp));
  },c.length);

draw(Labels,contour(f,(-1,-1),(1,1),c),p);
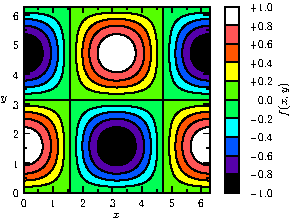
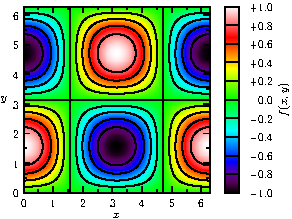
The next examples illustrates how contour lines can be drawn on color density images, with and without palette quantization:
import graph;
import palette;
import contour;

size(10cm,10cm);

pair a=(0,0);
pair b=(2pi,2pi);

real f(real x, real y) {return cos(x)*sin(y);}

int N=200;
int Divs=10;
int divs=1;
int n=Divs*divs;

defaultpen(1bp);
pen Tickpen=black;
pen tickpen=gray+0.5*linewidth(currentpen);
pen[] Palette=quantize(BWRainbow(),n);

bounds range=image(f,Automatic,a,b,3N,Palette,n);

// Major contours
real[] Cvals=uniform(range.min,range.max,Divs);
draw(contour(f,a,b,Cvals,N,operator --),Tickpen+squarecap+beveljoin);

// Minor contours (if divs > 1)
real[] cvals;
for(int i=0; i < Cvals.length-1; ++i)
  cvals.append(uniform(Cvals[i],Cvals[i+1],divs)[1:divs]);
draw(contour(f,a,b,cvals,N,operator --),tickpen);

xaxis("$x$",BottomTop,LeftTicks,above=true);
yaxis("$y$",LeftRight,RightTicks,above=true);

palette("$f(x,y)$",range,point(SE)+(0.5,0),point(NE)+(1,0),Right,Palette,
        PaletteTicks("$%+#0.1f$",N=Divs,n=divs,Tickpen,tickpen));

import graph;
import palette;
import contour;

size(10cm,10cm);

pair a=(0,0);
pair b=(2pi,2pi);

real f(real x, real y) {return cos(x)*sin(y);}

int N=200;
int Divs=10;
int divs=1;

defaultpen(1bp);
pen Tickpen=black;
pen tickpen=gray+0.5*linewidth(currentpen);
pen[] Palette=BWRainbow();

bounds range=image(f,Automatic,a,b,N,Palette);

// Major contours
real[] Cvals=uniform(range.min,range.max,Divs);
draw(contour(f,a,b,Cvals,N,operator --),Tickpen+squarecap+beveljoin);

// Minor contours (if divs > 1)
real[] cvals;
for(int i=0; i < Cvals.length-1; ++i)
  cvals.append(uniform(Cvals[i],Cvals[i+1],divs)[1:divs]);
draw(contour(f,a,b,cvals,N,operator --),tickpen+squarecap+beveljoin);

xaxis("$x$",BottomTop,LeftTicks,above=true);
yaxis("$y$",LeftRight,RightTicks,above=true);

palette("$f(x,y)$",range,point(SE)+(0.5,0),point(NE)+(1,0),Right,Palette,
        PaletteTicks("$%+#0.1f$",N=Divs,n=divs,Tickpen,tickpen));

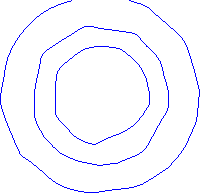
Finally, here is an example that illustrates the construction of contours from irregularly spaced data:
import contour;

size(200);

int n=100;

real f(real a, real b) {return a^2+b^2;}

srand(1);

real r() {return 1.1*(rand()/randMax*2-1);}

pair[] points=new pair[n];
real[] values=new real[n];

for(int i=0; i < n; ++i) {
  points[i]=(r(),r());
  values[i]=f(points[i].x,points[i].y);
}

draw(contour(points,values,new real[]{0.25,0.5,1},operator ..),blue);

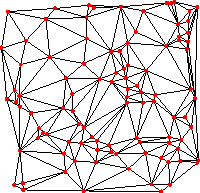
In the above example, the contours of irregularly spaced data are constructed by
first creating a triangular mesh from an array z of pairs:
int[][] triangulate(pair[] z);
size(200);
int np=100;
pair[] points;

real r() {return 1.2*(rand()/randMax*2-1);}

for(int i=0; i < np; ++i)
  points.push((r(),r()));

int[][] trn=triangulate(points);

for(int i=0; i < trn.length; ++i) {
  draw(points[trn[i][0]]--points[trn[i][1]]);
  draw(points[trn[i][1]]--points[trn[i][2]]);
  draw(points[trn[i][2]]--points[trn[i][0]]);
}

for(int i=0; i < np; ++i)
  dot(points[i],red);

The example Gouraudcontour.asy illustrates how to produce color
density images over such irregular triangular meshes.
Asymptote uses a robust version of Paul Bourke’s Delaunay triangulation
algorithm based on the public-domain exact arithmetic predicates written by
Jonathan Shewchuk.