8.17 slopefield 
To draw a slope field for the differential equation dy/dx=f(x,y) (or dy/dx=f(x)), use:
picture slopefield(real f(real,real), pair a, pair b,
                   int nx=nmesh, int ny=nx,
                   real tickfactor=0.5, pen p=currentpen,
                   arrowbar arrow=None);
Here, the points a and b are the lower left and upper
right corners of the rectangle in which the slope field is to be drawn,
nx and ny are the respective number of ticks in the
x and y directions, tickfactor is the fraction of
the minimum cell dimension to use for drawing ticks, and p is
the pen to use for drawing the slope fields.
The return value is a picture that can be added to
currentpicture via the add(picture) command.
path curve(pair c, real f(real,real), pair a, pair b);
takes a point (c) and a slope field-defining function f
and returns, as a path, the curve passing through that point. The points
a and b represent the rectangular boundaries over which
the curve is interpolated.
Both slopefield and curve alternatively accept a function
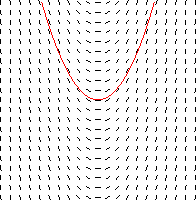
real f(real) that depends on x only, as seen in this example:
import slopefield;

size(200);

real func(real x) {return 2x;}
add(slopefield(func,(-3,-3),(3,3),20));
draw(curve((0,0),func,(-3,-3),(3,3)),red);