8.28 palette 
Asymptote can also generate color density images
and palettes. The following palettes are predefined in
palette.asy:
pen[] Grayscale(int NColors=256)¶a grayscale palette;
pen[] Rainbow(int NColors=32766)¶a rainbow spectrum;
pen[] BWRainbow(int NColors=32761)¶a rainbow spectrum tapering off to black/white at the ends;
pen[] BWRainbow2(int NColors=32761)¶a double rainbow palette tapering off to black/white at the ends, with a linearly scaled intensity.
pen[] Wheel(int NColors=32766)¶a full color wheel palette;
pen[] Gradient(int NColors=256, ... pen[] p)¶a palette varying linearly over the specified array of pens, using NColors in each interpolation interval;
The function cmyk(pen[] Palette) may be used to convert any
of these palettes to the CMYK colorspace.
A color density plot using palette palette can be generated from
a function f(x,y) and added to a picture pic:
bounds image(picture pic=currentpicture, real f(real, real),
             range range=Full, pair initial, pair final,
             int nx=ngraph, int ny=nx, pen[] palette, int divs=0,
             bool antialias=false)
The function f will be sampled at nx and ny
evenly spaced points over a rectangle defined by the points
initial and final, respecting the current graphical
scaling of pic. The color space is scaled according to the
z axis scaling (see automatic scaling). If divs > 1,
the palette is quantized to divs-1 values. A bounds structure
for the function values is returned:
struct bounds {
  real min;
  real max;
  // Possible tick intervals:
  int[] divisor;
}
This information can be used for generating an optional palette bar.
The palette color space corresponds to a range of values specified by
the argument range, which can be Full, Automatic,
or an explicit range Range(real min, real max). (The type range is
defined in palette.asy.)
Here Full specifies a range varying from the
minimum to maximum values of the function over the sampling interval,
while Automatic selects "nice" limits.
The examples
fillcontour.asy
and
imagecontour.asy
illustrate how level sets (contour lines) can be drawn on a color
density plot (see contour).
A color density plot can also be generated from an explicit real[][]
array data:
bounds image(picture pic=currentpicture, real[][] f, range range=Full,
             pair initial, pair final, pen[] palette, int divs=0,
             bool transpose=(initial.x < final.x && initial.y < final.y),
             bool copy=true, bool antialias=false);
If the initial point is to the left and below the final point, by default the array indices are interpreted according to the Cartesian convention (first index: x, second index: y) rather than the usual matrix convention (first index: -y, second index: x).
To construct an image from an array of irregularly spaced points
and an array of values f at these points, use one of the routines
bounds image(picture pic=currentpicture, pair[] z, real[] f,
             range range=Full, pen[] palette)
bounds image(picture pic=currentpicture, real[] x, real[] y, real[] f,
             range range=Full, pen[] palette)
An optionally labelled palette bar may be generated with the routine
void palette(picture pic=currentpicture, Label L="", bounds bounds,
             pair initial, pair final, axis axis=Right, pen[] palette,
             pen p=currentpen, paletteticks ticks=PaletteTicks,
             bool copy=true, bool antialias=false);
The color space of palette is taken to be over bounds bounds with
scaling given by the z scaling of pic.
The palette orientation is specified by axis, which may be one of
Right, Left, Top, or Bottom.
The bar is drawn over the rectangle from initial to final.
The argument paletteticks is a special tick type (see ticks)
that takes the following arguments:
paletteticks PaletteTicks(Label format="", ticklabel ticklabel=null,
                          bool beginlabel=true, bool endlabel=true,
                          int N=0, int n=0, real Step=0, real step=0,
                          pen pTick=nullpen, pen ptick=nullpen);
The image and palette bar can be fit to a frame and added and optionally aligned to a picture at the desired location:
size(12cm,12cm);

import graph;
import palette;

int n=256;
real ninv=2pi/n;
real[][] v=new real[n][n];

for(int i=0; i < n; ++i)
  for(int j=0; j < n; ++j)
    v[i][j]=sin(i*ninv)*cos(j*ninv);

pen[] Palette=BWRainbow();

picture bar;

bounds range=image(v,(0,0),(1,1),Palette);
palette(bar,"$A$",range,(0,0),(0.5cm,8cm),Right,Palette,
        PaletteTicks("$%+#.1f$"));
add(bar.fit(),point(E),30E);

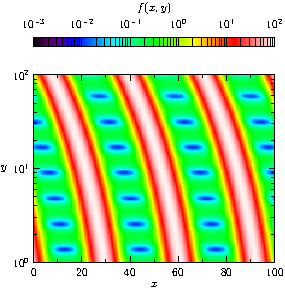
Here is an example that uses logarithmic scaling of the function values:
import graph;
import palette;

size(10cm,10cm,IgnoreAspect);

real f(real x, real y) {
  return 0.9*pow10(2*sin(x/5+2*y^0.25)) + 0.1*(1+cos(10*log(y)));
}

scale(Linear,Log,Log);

pen[] Palette=BWRainbow();

bounds range=image(f,Automatic,(0,1),(100,100),nx=200,Palette);

xaxis("$x$",BottomTop,LeftTicks,above=true);
yaxis("$y$",LeftRight,RightTicks,above=true);

palette("$f(x,y)$",range,(0,200),(100,250),Top,Palette,
        PaletteTicks(ptick=linewidth(0.5*linewidth())));

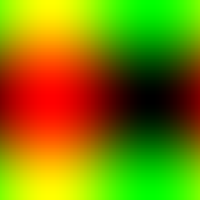
One can also draw an image directly from a two-dimensional pen array
or a function pen f(int, int):
void image(picture pic=currentpicture, pen[][] data,
           pair initial, pair final,
           bool transpose=(initial.x < final.x && initial.y < final.y),
           bool copy=true, bool antialias=false);
void image(picture pic=currentpicture, pen f(int, int), int width, int height,
           pair initial, pair final,
           bool transpose=(initial.x < final.x && initial.y < final.y),
           bool antialias=false);
as illustrated in the following examples:
size(200);

import palette;

int n=256;
real ninv=2pi/n;
pen[][] v=new pen[n][n];

for(int i=0; i < n; ++i)
  for(int j=0; j < n; ++j)
    v[i][j]=rgb(0.5*(1+sin(i*ninv)),0.5*(1+cos(j*ninv)),0);

image(v,(0,0),(1,1));

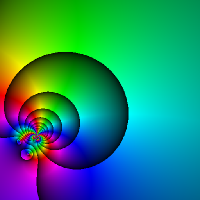
import palette;

size(200);

real fracpart(real x) {return (x-floor(x));}

pair pws(pair z) {
  pair w=(z+exp(pi*I/5)/0.9)/(1+z/0.9*exp(-pi*I/5));
  return exp(w)*(w^3-0.5*I);
}

int N=512;

pair a=(-1,-1);
pair b=(0.5,0.5);
real dx=(b-a).x/N;
real dy=(b-a).y/N;

pen f(int u, int v) {
  pair z=a+(u*dx,v*dy);
  pair w=pws(z);
  real phase=degrees(w,warn=false);
  real modulus=w == 0 ? 0: fracpart(log(abs(w)));
  return hsv(phase,1,sqrt(modulus));
}

image(f,N,N,(0,0),(300,300),antialias=true);

For convenience, the module palette also defines functions
that may be used to construct a pen array from a given function and palette:
pen[] palette(real[] f, pen[] palette);
pen[][] palette(real[][] f, pen[] palette);